Direct and Controlled Manipulation of Nanometer-Sized Particles Using the Non-Contact Atomic Force Microscope
by
T. R. Ramachandran*, C. Baur, A. Bugacov, A. Madhukar, B. E. Koel, A. Requicha, and C. Gazen
Laboratory for Molecular Robotics, University of Southern California, Los Angeles, CA 90089.
*corresponding author: [email protected] ,
URL: http://www-lmr.usc.edu:80/~lmr
|
This is a draft paper
for a talk at the
Fifth
Foresight Conference on Molecular Nanotechnology.
The final version has been submitted
for publication in the special Conference issue of Nanotechnology.
This page uses the HTML <sup> and
<sub> conventions for superscripts and subscripts. If
"103" looks the same as "103"
then your browser does not support superscripts. If "xi"
looks the same as "xi" then your browser does not
support subscripts. Failure to support superscripts or
subscripts can lead to confusion in the following text,
particularly in interpreting exponents.
Abstract
In this paper, we present techniques for the direct and controlled manipulation of nanoscale three-dimensional (3D) features using the non-contact atomic force microscope (NC-AFM). A systematic examination of the nature of NC-AFM images of such 3D features leads us to propose two distinct protocols for nanomanipulation. The first protocol consists of switching off the NC-AFM feedback loop just as the tip approaches a nanofeature of interest. This results in tip-nanofeature contact and causes the feature to be "pushed" along the surface as the tip continues to move laterally. The second protocol exploits a peculiar feature of the NC-AFM which produces reversal of contrast of nanofeatures from positive to negative in NC-AFM images, due to a feedback instability. The contrast reversal, which is likely to be universal to NC-AFM, occurs with changes in imaging conditions and potentially leads to tip-sample contact, thereby allowing manipulation. This second technique has the advantage of easier identification of the manipulation regime and the potential for manipulating features that are only a few nm in size. We demonstrate the viability of these two protocols by directly manipulating gold particles of diameters 5 and 15 nm into pre-determined patterns on a mica surface. We also illustrate a simple, generic approach that is useful for obtaining detailed information on the mechanism of any manipulation based on the scanning probe microscope.
1. Introduction
Since its invention [1,2], the non-contact atomic force microscope (NC-AFM) has been increasingly used for imaging a wide class of materials, ranging from metals to semiconductors to polymers to biological materials [3]. The NC-AFM offers unique advantages over other contemporary scanning probe techniques such as contact atomic force microscopy (C-AFM) and scanning tunneling microscopy (STM). The absence of repulsive forces (present in C-AFM) in NC-AFM permits its use in the imaging of "soft" samples [3] and, unlike the STM, the NC-AFM does not require conducting samples. At the same time, the ability to resolve atomic rows, steps, or vacancies on flat (i.e., "two-dimensional" or 2D) semiconductor surfaces using the NC-AFM, as demonstrated recently [4-8], has brought this microscope almost on par with the STM. Nevertheless, the theoretical understanding of NC-AFM imaging, even of flat 2D surfaces [8,9], has lagged well behind the applications of the NC-AFM largely because of the complexity of the technique. The interpretation of NC-AFM images of three-dimensional (3D) features is even more difficult, because of the influence of the finite size and shape of the tip [10].
Apart from the imaging capabilities of the NC-AFM, some inroads are currently being made into utilizing the NC-AFM for the purposes of nanoscale manipulation. Baur et al. [11] demonstrated the successful nanomanipulation of 15-27nm diameter Au particles in air while Junno et al. [12] have demonstrated nanomanipulation in air of 30nm GaAs particles, both based on a similar approach utilizing the NC-AFM. These efforts are to be compared with the achievements of STM and C-AFM in the manipulation of nanoscale 3D objects such as clusters or molecules. In ultra-high vacuum (UHV), the STM has been used to manipulate molecules (e.g., porphyrins, C60) on the size scale of 1-2nm [13-15]. The C-AFM has also been used to physically manipulate objects in various environments but on a larger size scale of ~10-100nm [16-19].
The achievements of the NC-AFM have provided an impetus to efforts aimed at further understanding the operating mechanism of this microscope, and its exploitation in advancing the state-of-the-art in nanomanipulation. In this paper, we address the two important issues of: (a) the scientific underpinnings of NC-AFM imaging and manipulation of nanoscale 3D objects, and (b) the translation of the knowledge base accumulated through (a) to the development of reliable protocols for nanomanipulation based on the NC-AFM. Section 2 of this paper outlines some experimental details. In Sec. 3 we present results that reveal a peculiar property of the NC-AFM - the reversal of contrast of nanoscale 3D features (also denoted as nanoparticles) in NC-AFM images from positive to negative. Experimental data and a simplified force-gradient model of the NC-AFM indicate that such contrast reversals can arise due to instabilities in the NC-AFM feedback. The instabilities are linked to the nature of the interaction force-gradient between sample and tip. In Sec. 4, we propose two different protocols for NC-AFM based manipulation, based on the knowledge gained about the mechanism of NC-AFM imaging. The first protocol (Sec. 4.1) takes advantage of the typical tip-sample separation during NC-AFM operation and involves a switching off of the NC-AFM feedback as the tip approaches a nanoparticle. This results in tip-nanoparticle contact which "pushes" the particle to a new location as the tip is moved laterally. The second protocol (Sec. 4.2) exploits the phenomenon of negative contrast described in Sec. 3 and involves changing the NC-AFM imaging parameters selectively in order to induce tip-sample contact. We demonstrate the successful application of these protocols via nanomanipulation of 5-27 nm diameter Au particles on a poly-L-lysine functionalized mica surface. We conclude with a brief comparison of the strengths and limitations of these two protocols.
2. Experimental
The results reported in this paper were all obtained in air at room temperature using a Park Scientific Instruments Autoprobe CP scanning probe microscope (SPM) operating in the non-contact mode. This NC-AFM works via the principle of "amplitude modulation" detection [1], which we briefly summarize here. This detection scheme exploits the change in the amplitude, A, of the oscillation of a cantilever (CL) due to the interaction of a tip mounted at the end of the CL with a sample. To the first order, the working of this NC-AFM can be understood in terms of a force-gradient model as shown earlier [1-4,20,21]. According to this model, in the limit of small A, a CL approaching a sample undergoes a shift,   , in its natural resonance frequency, 0, towards a new value given by: , in its natural resonance frequency, 0, towards a new value given by:
 (1) (1)
where eff is the new, effective resonance frequency of the CL of nominal stiffness k0 and mass m in the presence of a force gradient F'(z) due to the sample. The quantity z represents an effective tip-sample separation while =eff -0 is typically negative, for the case of attractive forces [4]. If the CL is initially forced to vibrate at a set>0, then the shift in the resonance spectrum of the CL towards lower frequencies will cause a decrease in the oscillation amplitude at set as the tip approaches the sample [1,2]. This change in A is used as the input to the NC-AFM feedback. To obtain a NC-AFM image the user initially chooses a value Aset as the setpoint such that Aset<A(set) when the CL is far away from the sample. The NC-AFM feedback then moves the CL closer to the sample until its instantaneous oscillation amplitude, A, drops to Aset at the user-defined driving frequency set. At this point the sample can be scanned in the x-y plane with the feedback keeping A = Aset = constant in order to obtain a NC-AFM image. The NC-AFM feedback brings the CL closer (on average) to the sample if Aset is decreased at any point, and moves the CL farther away from the sample (on average) if Aset is increased. Overall, the implication of the above model is that the NC-AFM image may be considered, in the limit of small A, to be a map of constant interaction-force gradient experienced by the tip due to the sample.
The samples examined in this study consisted of: (i) nanofeatures formed on a mica surface upon cleavage of the latter, and (ii) 5-27 nm diameter Au nanoparticles (covered with a thin surface layer of gold chloride) deposited from colloidal solution onto a mica surface that was initially functionalized with a layer of poly-L-lysine. The details of the Au sample preparation have been discussed elsewhere [11]. The poly-L-lysine layer is positively charged in the room temperature ambient and is required to bind the negatively charged, gold chloride coated gold particles to the negatively charged mica surface [11]. The CLs used for these studies were Park Scientific Instruments "Ultralevers" of with nominal k0~18 N/m and 0 in the range ~300-400 kHz [22].
3. NC-AFM imaging of nanoscale 3D features
3.1 Contrast reversal
Figure 1 shows NC-AFM images in air of a nanofeature on a cleaved mica surface. The same nanofeature (labeled D) is shown as a function of NC-AFM imaging setpoint, Aset, in panels (a)-(d), keeping nset constant. In (a), where Aset = 14nm, the particle appears in positive contrast, i.e., as a "hill" with respect to the surrounding flat regions, at an apparent height of ~1nm. In (b) however, for Aset = 4nm, the contrast of the same particle is completely negative, i.e., it appears as a "valley" with respect to the surrounding flat regions. The reversibility of the contrast is evident in panel (c), obtained after (b). Here Aset was increased to 15nm, which brought the contrast back to positive. The contrast reversal is generally quite abrupt as a function of Aset as seen in panel (d). The upper half of this image was acquired with Aset = 9nm and the particle appears in positive contrast here. At the line indicated by the arrow, Aset was decreased slightly to 8.5nm, upon which the contrast immediately switched to negative as seen in the lower half of the image.
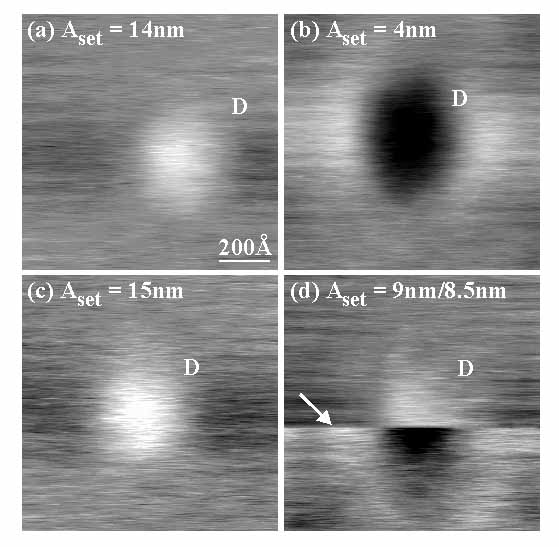
Fig. 1: NC-AFM images obtained in air of the same nanoscale 3D feature (labeled D) on a cleaved mica surface. All images were obtained at a constant set of ~309.14 kHz (0~309.00 kHz). In panel (a), where Aset = 14nm, the nanofeature appears in positive contrast, i.e., it images as a protrusion on the surface (~1nm high). When Aset is decreased to 4nm, the nanofeature images in complete negative contrast, i.e., as a hollow. The contrast reversal is reversible, as seen in (c) taken after (b), with Aset = 15nm. Further, the change in contrast from positive to negative or vice versa is abrupt as a function of Aset as shown in (d). Here the top half of the image was obtained with Aset = 9nm and the nanofeature appears in positive contrast. At the line shown by the arrow, Aset was decreased slightly to 8.5nm. Immediately the contrast changed to negative, as seen in the lower half of the image.
Figure 2 illustrates an example where the change to negative contrast is not complete but only partial, using a sample of 5nm Au nanoparticles [23] on a mica surface functionalized with poly-L-lysine. In Fig. 2(a), at Aset = 5nm the Au particles appear in positive contrast whereas in Fig. 2(b) (Aset = 4nm) they appear in partial negative contrast (see the dark spot near the center of the particles marked by an arrow). A pair of the same particles have been labeled 1 and 2 in both figures for reference. We have also observed and studied the phenomenon of contrast reversal in contamination-free, in-situ UHV NC-AFM images of nanoscale InAs quantum dots on GaAs [20]. The results in air and UHV suggest that the phenomenon of contrast reversal is universal in NC-AFM imaging of nanoscale 3D features.
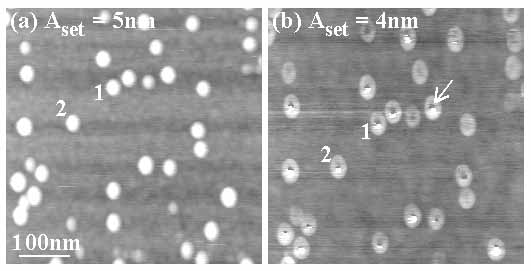
Fig. 2: NC-AFM images in air of 5nm diameter Au nanoparticles on a poly-L-lysine terminated mica surface. Both images were obtained at constant set of ~334.14 kHz (0~333.97 kHz). In (a) the nanoparticles appear as ~5nm high protrusions (as expected) for Aset = 5nm. However, when Aset is decreased to 4nm in (b), partial negative contrast is seen over the nanoparticles (see arrow).
3.2 Interpretation of contrast reversal in NC-AFM images
The complexity of the NC-AFM, exemplified by the ongoing debate on the interpretation of NC-AFM images of 2D surfaces [4-9], and the added issue of tip shape/size effects make the interpretation of the above contrast reversal phenomenon a formidable task. In particular, the simplified force-gradient model of NC-AFM described by Eq. (1) may be insufficient to describe the nature of the images for the relatively large values of A used in the measurements. However, the universality of the contrast reversal phenomenon prompts us to examine whether even within the assumptions of the simplest model, negative contrast can arise in the images of nanoscale 3D features.
Figure 3 shows a schematic of the force, F(z), and the force gradient, F'(z), experienced by the tip due to the sample, as a function of z. The regime labeled I is the typical operating regime of the C-AFM. The region marked III corresponds to the stable operating region of the NC-AFM within the assumptions of the force-gradient model and given the design of our NC-AFM. That this is so can be understood as follows [20]. In Region III, with decreasing z, F'(z) increases and this will lead to a decrease in eff in Eq. (1), and thus in A as well. This decrease in A as the tip comes closer to the sample is consistent with the design rule of our NC-AFM as explained earlier. Consequently, a nanoscale 3D feature will be imaged in positive contrast in this region, labeled "Stable Feedback" in Fig. 3. On the other hand, in Region II (and I), as z decreases, F'(z) also decreases. Therefore, eff and A increase with decreasing z. If the NC-AFM tip, initially in Region III, suddenly enters region II or I when it comes near a 3D feature (e.g., due to sudden attractive forces or tip-sidewall interactions that occur faster than the response time of the feedback ~1ms) then, the feedback will become unstable. For instance, in regions II or I, if A exceeds Aset even infinitesimally because of a sudden decrease in tip-sample spacing, then the feedback would move the tip still closer to the feature in an attempt to "decrease" A to Aset, which is of course impossible. The result is a "runaway" or unstable feedback which can cause the nanoscale 3D feature to appear in partial or complete negative contrast in the NC-AFM image. A feedback instability implies that Aset is only a nominal setpoint and may not actually be achieved within the negative contrast regions. Experimentally, we have observed instabilities in NC-AFM images within negative contrast regions in the form of random fluctuations in the scanner position, especially when the negative contrast is pronounced [20,24]. A consequence of such a feedback instability is that tip-sample contact might occur. This is consistent with our experimental observation that prolonged scanning of an area in which nanoscale 3D features appear in negative contrast leads to damage on the surface (not shown; also see Ref. 25).
Fig. 3: Schematic showing the force, F(z), and the force gradient, F'(z), acting on the NC-AFM tip due to the sample, as a function of the effective tip-sample separation, z. Region I is the usual regime of operation of the C-AFM. Based on the consequences of the force-gradient model of NC-AFM imaging (see text), regions II and III are identified as regions of unstable and stable NC-AFM feedback, respectively.
The simple model discussed above may not be directly applicable to the NC-AFM images reported in this paper which were obtained with non-negligible amplitudes. However, we suggest that a feedback instability related to the nature of the force-gradient curve may contribute significantly to the phenomenon of contrast reversal. In the following section, we show how our knowledge of the imaging process can be used to devise reliable nanomanipulation schemes using the NC-AFM.
4. Manipulation of nanoscale 3D features using the NC-AFM
The two generic characteristics of the NC-AFM that we utilize for nanomanipulation are: (1) the operating region of the NC-AFM is such that the closest point of approach of the tip to the sample during imaging is likely to be of the order of a few nm to a few tens of nm [3], and (2) the onset of negative contrast images of nanoscale 3D features qualitatively demarcates a regime in which tip-sample contact might occur. In general, there is no a priori way of predicting the smallest tip-sample separation in (1) above owing to its dependence on the particular materials system, tip/CL and environment. However, for the Au samples used in our study we roughly estimated that the typical distance, s0, between the sample surface and the closest point of approach of the tip to the sample during imaging is of the order of ~4-5nm. In order to make this crude estimate of s0, we first started by imaging the Au samples with the NC-AFM in the positive contrast mode. We then moved the oscillating CL towards the surface (without altering Aset) until the tip came into destructive contact with the surface (as inferred from tip-induced ~1nm deep grooves in the surface). We found that the scanner (and thus the mean position of the cantilever) was displaced in z by ~5nm during this process suggesting that s0 was in the range of ~4-5nm. The onset of tip-sample contact in (2) above was simply detected by entering the negative contrast mode and then further lowering Aset until some surface damage was detected during scanning. The translation of characteristics (1) and (2) above into working protocols in described in the following.
4.1 "Feedback Off" Protocol for Nanomanipulation
If s0 is ~5nm, then we expect that during a scan the NC-AFM tip is likely to come into contact with any nanofeature that is >s0 (5nm) in height (measured from the flat surface of the sample), if the NC-AFM feedback is disabled just before the tip reaches this feature. This is the principle governing our first protocol. This protocol is therefore appropriately referred to as the "Feedback Off" protocol and is depicted schematically in Fig. 4. Initially, an image of the sample in the positive contrast mode is obtained. Then, a nanoparticle of interest is chosen and a line scan is performed approximately over the center of the particle [11]. Another line scan is then initiated (Fig. 4(a)) but this time, the NC-AFM feedback is disabled just before the tip reaches the nanoparticle (Fig. 4(b)). This causes the tip to come into contact with the nanofeature. By keeping the feedback disabled for a certain interval of time/distance, the particle can be moved in a desired direction to a pre-determined location (Fig. 4(b)). Once the particle has been moved (or "pushed"), the feedback is turned on again to return to the imaging mode (Fig. 4(c)). The viability of this protocol has already been demonstrated by us for 15 and 27nm gold nanoparticles, and in particular, by the controlled manipulation of a random arrangement of 15nm Au particles into a pattern that spelled out the letters "USC" [11].
Fig. 4: Schematic illustrating the mechanism of nanomanipulation using the "Feedback Off" protocol. In (a), the tip is in the imaging mode and is approaching a nanoparticle of interest. When the tip comes very close to the nanoparticle, the NC-AFM feedback is turned off (b) which causes tip-nanoparticle contact. By moving the tip laterally, the nanoparticle is pushed to a new, pre-determined location (b). Finally, the feedback is turned back on to return to the imaging mode (c). During this process the value of Aset is left unchanged by the user.
An issue of interest here is whether each particle is indeed moved due to repulsive forces or, perhaps, by the tip "dragging" a particle that is attracted to it. The fact that these particles were "swept" away during C-AFM imaging [11] showed that repulsive forces could move these particles. To unambiguously eliminate the possibility of "dragging" due to attractive forces we performed the following simple experiment (Fig. 5). In Fig. 5(a) is shown a schematic of a nanoparticle and a NC-AFM line scan over this particle prior to manipulation. The lines m and n demarcate the two ends of the manipulation window. For a scan proceeding from left to right, the feedback is disabled at point m and re-enabled at point n. In the case shown in Fig. 5(a), the point m was chosen to be initially located just above the center of the particle and it was then moved towards n in subsequent trials, keeping the position of n fixed. For every position of m at or to the right of the position shown in Fig. 5(a) there was no movement of the particle at all, when the feedback was turned off in the window m-n (for all particles surveyed). Thus, the possibility of attractive forces causing Au nanoparticle motion is excluded, firmly establishing that repulsive force ("pushing") is involved in the manipulation event.
To obtain further insight into the mechanism of pushing, we chose the windows m and n as shown in Fig. 5(b). Here n was fixed right over the middle of the particle and m was chosen to its left and swept as indicated by the arrows. For each choice of position m, the quantity h corresponding to the height, at position m, in the cross-sectional profile obtained prior to manipulation was noted. We found that there is a maximum value of h, hmax, beyond which (i.e., for h>hmax) there was no detectable displacement ( det~2nm) of the nanoparticle. The value hmax typically varied from ~7-10nm for the 27nm Au particles [26]. From this, we can approximately estimate the maximum allowed separation (smax) between the tip and the flat sample surface before the feedback is turned off, for which detectable particle displacement will be found. Roughly, smax det~2nm) of the nanoparticle. The value hmax typically varied from ~7-10nm for the 27nm Au particles [26]. From this, we can approximately estimate the maximum allowed separation (smax) between the tip and the flat sample surface before the feedback is turned off, for which detectable particle displacement will be found. Roughly, smax  s0+hmax. For the 27nm particles, smax estimated in this way is ~11-15nm. This indicates that for the "Feedback Off" protocol to work the lowest point of approach of the tip towards the flat surface (prior to switching off of the feedback) should approximately lie below the center line of the nanoparticle. s0+hmax. For the 27nm particles, smax estimated in this way is ~11-15nm. This indicates that for the "Feedback Off" protocol to work the lowest point of approach of the tip towards the flat surface (prior to switching off of the feedback) should approximately lie below the center line of the nanoparticle.
Fig. 5: Schematics of manipulation experiments aimed at obtaining a deeper understanding of the mechanism of the "Feedback Off" protocol. In these figures the positions labeled m and n correspond to the points where the feedback is turned off and on, respectively, during a scan proceeding from left to right. The quantity mn is the size of the manipulation window m-n. The value h corresponds to the height in the cross-sectional profile obtained prior to manipulation at position m. The direction of arrows show how m or n are varied in the experiments. See text for discussion.
Figure 5(c) illustrates how one can study the effect of the size of the manipulation window m-n, mn, on the corresponding displacement, d, of the particle. Here m is fixed at the position shown and n is initially placed right above the middle of the particle. The particle is then pushed and the value of d noted. The window positions m and n are then displaced by d in the direction of the push and in addition, n is moved a little further towards the right to increase mn (as shown by the arrow in Fig. 5(c)). The next manipulation event is then carried out. This process is repeated for the same particle in successive pushes with increasing mn. The results of such experiments on the 27nm particles show variations between particles, which are expected because of the likely inhomogeneous nature of their binding to the poly-L-lysine [26]. There are, however, two interesting findings that provide insight into the nature of the pushing process as well as the nature of the binding. These findings are illustrated in the example shown in Fig. 6, which plots d for the same 27nm Au nanoparticle in successive pushes (as explained above) as a function of mn. The dashed line from the bottom left to the top right shows the behavior d = mn, i.e., the imaginary case where the particle displacement equals the window size. For all particles, the actual data points always lie below this line (i.e., d-mn < 0). As seen in Fig. 6, d-mn for the initial push is significantly larger than for the subsequent pushes. This indicates that the resistance offered by the particle to being pushed is greatest for the first push. Secondly, and interestingly, for the second and higher pushes, d  mn [27]. These two observations might be an indication that once a particle is dislodged from its initial location, the new bonds (if any) that the particle may form with the substrate are weaker, and might be relatively independent of its location on the surface [28]. The fact that d is always significantly less than mn [11] indicates that the pushing might be preceded by some deformation of the tip/CL or the particle. mn [27]. These two observations might be an indication that once a particle is dislodged from its initial location, the new bonds (if any) that the particle may form with the substrate are weaker, and might be relatively independent of its location on the surface [28]. The fact that d is always significantly less than mn [11] indicates that the pushing might be preceded by some deformation of the tip/CL or the particle.
Fig. 6: Plot of the lateral displacement of the same 27nm diameter Au particle on poly-L-lysine functionalized mica, for successive pushes with varying manipulation window size, mn. The "Feedback Off" protocol was used to achieve the manipulation. The dashed line from the bottom left to the top right shows the line d = mn, corresponding to the imaginary case where the particle displacement exactly equals the manipulation window size. The quantity d-mn is most negative for the first push signifying that the particle offers the greatest resistance to motion in the first push. For subsequent pushes, d is approximately proportional to mn [27].
More systematic studies of the manipulation process, performed by varying the positions m and n in Fig. 5 will be published elsewhere. We note that we have so far not been able to manipulate 5nm gold particles using the above protocol. This is not surprising considering the estimated value of s0 of ~5nm.
4.2 "SETPOINT CHANGE" Protocol for Nanomanipulation
The essence of this protocol, which exploits the negative contrast phenomenon discussed in Sec. 3 above, is depicted schematically in Fig. 7. The procedure followed prior to the manipulation event is exactly the same as in Sec. 4.1 and the NC-AFM tip approaches the nanoparticle in the positive contrast imaging mode, with Aset=A1 (Fig. 7(a)). When the tip is in close proximity to the nanoparticle, the computer is programmed to reduce Aset to a value A2. The value A2 is chosen such that it is sufficient to induce tip-nanoparticle contact. Typically A2 is at least a few nm below the value of Aset at the transition point between positive and negative contrast for the nanoparticle (e.g., this latter value is Aset~4nm for the 5nm Au particles shown in Fig. 2). The tip is moved laterally with Aset=A2 for a predetermined time/distance as shown in Fig. 7(b), and the nanoparticle is pushed to a new location. Once this is accomplished, the computer resets Aset to A1 such that the tip returns to the imaging mode (positive contrast) (Fig. 7(c)).
Fig. 7: Schematic illustrating the mechanism of the "Setpoint Change" manipulation protocol. Panel (a) shows the NC-AFM tip approaching the nanoparticle of interest. At this stage, Aset = A1 corresponding to the positive contrast, imaging mode. When the tip is in close proximity to the particle, Aset is decreased to A2 (b). The value A2 is chosen such that this would correspond to the negative contrast regime, and more importantly, so that tip-nanoparticle contact is induced. The tip is moved laterally with Aset = A2 for a predetermined interval of time/distance, which in turn displaces the nanoparticle as desired (b). Once the particle has been moved to a new location, the value of Aset is reset to A1 to return to the imaging mode (c).
Figures 8-10 demonstrate the viability of the "Setpoint Change" protocol for nanomanipulation. These figures show examples of manipulation of the 5nm gold particles on a mica surface terminated by poly-L-lysine. The values of A1 and A2 were 5nm and 1nm, respectively, for the results shown in these images. All the images were acquired with Aset=A1=5nm [23]. Figure 8 shows how a random distribution of 5nm gold particles in panel (a) was manipulated to form a pre-determined chain-like pattern in Fig. 8(b). The labels 1-3 in the figure correspond to the same set of three particles that were left untouched, for reference purposes. (The large bright feature in the lower right corner of the images is a lone 15nm high Au nanoparticle.)
Fig. 8: NC-AFM images in air demonstrating direct and controlled nanomanipulation of 5nm Au particles using the "Setpoint Change" protocol. The labels 1-3 correspond to the same set of 3 particles in both images, left untouched for reference purposes. A random distribution of particles in (a) was rearranged to form the chain-like pattern in (b). For the manipulation, A1=5nm and A2=1nm were used. Both images were obtained with Aset=5nm and set fixed at ~394.86 kHz (0~394.51 kHz). The lone, bright feature in the lower right corner of both images is a 15nm diameter Au particle.
Figure 9 shows how the "Setpoint Change" protocol can be used effectively to push two particles simultaneously. In Fig. 9(a), two 5nm Au particles are shown enclosed in a dashed box. To push these particles together, the tip was forced to follow a path approximately bisecting the two particles from left to right, as shown by the arrow. The result is seen in Fig. 9(b) where one large feature is seen within the box in contrast to two distinctly separate features in (a). Finally, the pair in (b) was moved by a small amount in the direction of the arrow to a new location in (c). A cross-sectional profile across the pair is shown in Fig. 9(d), corresponding to the black line inside the dashed box of Fig. 9(c). The profile shows the presence of two particles (marked by arrows) within the bright feature contained in the dashed box of panel (c). For reference, the same feature labeled 1 is shown in Figs. 9 (a) to (c).
Fig. 9: NC-AFM images demonstrating the use of the "Setpoint Change" protocol to move two 5nm Au nanoparticles simultaneously. In (a) a pair of particles are shown enclosed in the dashed box. The NC-AFM tip was forced to follow a path roughly bisecting these two particles in the direction of the arrow. The result of the manipulation event is shown in (b). The pair is seen to have moved together and combined to form a (laterally) larger feature (see box in (b)). This larger feature was moved in the direction of the arrow in (b), slightly to the left. The result is seen in (c). Panel (d) shows a cross-sectional profile of the feature in (c), corresponding to the black line inside the box in (c). The profile shows the presence of two maxima (marked by arrows) corresponding to the two particles in the pair. (The absence of the expected dip in the profile between the two maxima is due to the size of the tip. Also, the profile does not run exactly through the middle of both particles and hence appears asymmetric). All imaging/manipulation parameters were identical to those in Fig. 8.
Figure 10 shows how a nanoparticle can be pushed up and over surface protrusions or obstructions. In Fig. 10(a), a 5nm Au particle (labeled 1) is shown along with a surface protrusion (~2nm high) labeled B. Pushing particle 1 towards the feature B (see arrow in panel (a)) resulted in this particle sitting on top of B, making B invisible (Fig. 10(b)) and making particle 1 appear taller in the image (brighter than in panel (a)). Subsequently, the particle 1 was pushed farther to the right as shown by the arrow in panel (b), upon which it moved down and away from B. The result is shown in Fig. 10(c) where both features 1 and B are visible once again.
Fig. 10: NC-AFM images illustrating the pushing of a 5nm Au nanoparticle (labeled 1) over a ~2nm high surface protrusion (B) using the "Setpoint Change" protocol. In (a) the particle 1 is pushed towards the feature B. The result is that the particle sits on top of B making B invisible and feature 1 appear brighter/taller (panel (b)). On further pushing, the particle 1 moves down B and towards the right to its new position in (c), where both features 1 and B are seen again. All imaging/manipulation parameters were identical to those in Fig. 8.
4.3 Comparison of manipulation protocols
Unlike the "Feedback Off" protocol, the "Setpoint Change" protocol is not limited by the height of the nanoparticle in relation to the closest tip-sample approach distance (s0). Therefore, it can potentially be used for entities as small as nm-sized molecules. On the other hand, the "Feedback Off" protocol is to be preferred in the case of larger particles because it provides greater control, unlike the Setpoint Change protocol which relies on a feedback instability to induce tip-sample contact. In addition, the distances by which the particles can be moved using the "Setpoint Change" protocol are typically less than those achievable using the "Feedback Off" protocol. However, the regime for manipulation for any materials system can be identified more easily with the Setpoint Change protocol due to the universality of the contrast reversal phenomenon. Both protocols are easy to implement and test on a wide variety of materials systems, in any environment [29].
The main limitation of both protocols is that they can produce tip and/or nanofeature damage due to repulsive forces during manipulation. This can affect the reproducibility of the manipulation. The success and reproducibility of the manipulation on a given nanofeature is expected to be a function of the local bonding properties of the nanofeatures to the substrate. Greater control of the sample preparation will allow better control over the manipulation of each particle. By varying the manipulation window (as in Fig. 5) a rich amount of information can be extracted about the mechanism of manipulation. This approach can be used in any manipulation experiment using any SPM technique.
5. Conclusion
In conclusion, we have presented two different techniques for direct manipulation of nanoscale 3D features using the NC-AFM. The first one, the "Feedback Off" protocol, exploits the typical tip-sample separation during NC-AFM imaging and involves a switching off of the feedback to push the nanoparticle. The second technique, called the "Setpoint Change" protocol, works by a change in the NC-AFM imaging setpoint to achieve manipulation. This technique exploits a remarkable property we find in NC-AFM images of nanoscale 3D features—a reversal of image contrast that can lead to tip-sample contact. We propose that the contrast reversal phenomenon is universal to NC-AFM imaging of nanoscale 3D features. Our experiments indicate that pushing of the nanoparticle by the tip via repulsive forces is the mechanism of manipulation in both of the above protocols.
Additionally, we have demonstrated a simple approach, involving a variation of the manipulation window, which provides a rich amount of information about the manipulation process. Both of the manipulation protocols and the manipulation-window variation can be applied to a wide variety of materials systems for any SPM-based nanomanipulation. Finally, by drawing on a simple force-gradient model, we emphasize the importance of understanding the basic mechanism of NC-AFM imaging in the design and interpretation of manipulation experiments.
This work was supported by the Zohrab A. Kaprielian Technology Innovation Fund of the University of Southern California.
References
[1] Martin Y, Williams C C and Wikramasinghe H K 1987 J. Appl. Phys. 61 4723
[2] Albrecht T R, Grutter P, Horne D and Rugar D 1991 J. Appl. Phys. 69 668
[3] Wiesendanger R 1994 Scanning Probe Microscopy and Spectroscopy (Great Britain: Cambridge University Press)
[4] Giessibl F J 1995 Science 267 68
[5] Sugawara Y, Ueyama H, Uchihashi T, Ohta M, Morita S, Suzuki M, and Mishima S 1997 Appl. Surf. Sci. 113/114 364
[6] Güthner P 1996 J. Vac. Sci. Technol. B 14 2428
[7] Lüthi R, Meyer E, Bammerlin M, Baratoff A, Lehmann T, Howald L, Gerber Ch and Güntherodt H J 1996 Z. Phys. B 100 165
[8] Erlandsson R, Olsson L and Martensson P 1996 Phys. Rev. B 54 R8309
[9] Perez R, Payne M C, Stich I and Terakura K 1997 Phys. Rev. Lett. 78 678
[10] Griffith J E and Grigg D A 1993 J. Appl. Phys. 74 R83
[11] Baur C, Gazen B C, Koel B, Ramachandran T R, Requicha A A G and Zini L 1997 J. Vac. Sci. Technol. B 15 1577
[12] Junno T, Deppert K, Montelius L and Samuelson L 1995 Appl. Phys. Lett. 66 3627
[13] Cuberes M T, Schlittler R R and Gimzewski J K Appl. Phys. Lett. 69 3016
Jung T A, Schlittler R R, Gimzewski J K, Tang H and Joachim C 1996 Science 271 181
[14] Beton P H, Dunn A W and Moriarty P 1995 Appl. Phys. Lett. 67 1075
[15] Maruno S, Inanaga K and Isu T 1993 Appl. Phys. Lett. 63 1339
[16] Kim Y and Lieber C M 1992 Science 257 375
[17] Lüthi R, Meyer E, Haefke H, Howald L, Gutmannsbauer W and Güntherodt H J 1994 Science 266 1979
[18] Schaefer D M, Reifenberger R, Patil A and Andres R P 1995 Appl. Phys. Lett. 66 1012
[19] Falvo M R, Washburn S, Superfine R, Finch M, Brooks Jr F P, Chi V and Taylor II R M 1997 Biophys. J. 72 1396
[20] Ramachandran T R, Kobayashi N P, Heitz R, Chen P and Madhukar A 1997 Mater. Res. Soc. Symp. Proc. 440 31
[21] Gady B, Schleef D, Reifenberger R, Rimai D and DeMejo L P 1996 Phys. Rev. B 53 8065
[22] For the NC-AFM images reported in this paper, the driving frequency set was chosen to be typically between 0.15 - 0.60 kHz higher than the natural resonance, 0, of the CL.
[23] The apparent lateral sizes of the 3D nanoparticles in these and all other images shown in this paper are greater than their actual sizes due to broadening resulting from the influence of the finite size of the tip.
[24] Ramachandran T R, Madhukar A, Chen P and Koel B E J. Vac. Sci. Technol. B (submitted).
[25] Durig U and Zuger O 1994 Phys. Rev. B 50 5008. These authors reported the observation of negative contrast in UHV NC-AFM images of polycrystalline Ir. In addition, they found a "cleansing effect" on the surface, i.e., disappearance of certain features observed in positive contrast, due to repetitive scanning of the same area in which some features were imaged in negative contrast.
[26] Occasionally hmax was as high as ~17nm. This is not surprising because the sample preparation method (Ref. 11) is such that there is limited control over the bonding of the Au nanoparticles to the poly-L-lysine. We expect differences in the binding strengths of the Au particles across the sample and this would result in lower or higher values for hmax depending on whether the binding is stronger or weaker for that particular particle.
[27] This relationship appears to be valid for mn<~125nm. For mn>~125nm, the quantity d-mn becomes more negative than for mn<~125nm causing a negative deviation from the proportionality. Although the reason for this is not clear, it might in part be due to the fact that as mn increases, the time (t) for which the feedback is kept switched off increases. As t increases, thermal drift in the z-direction could become appreciable enough to affect the relative position of the tip and nanofeature, which might contribute to the above observation.
[28] At this time it is difficult to independently verify this supposition, given the yet unknown details of the chemical processes occurring during the preparation [11] of these Au samples, and their dependence on the preparation conditions.
[29] Reference 11 provides more discussion on some of the manipulation issues involving the "Feedback Off" protocol.
|